Diagnostics
Diagnostics are a way to indicate issues with the code.
Errors & warnings
Vadacode constantly analyze your code in the background. Since we love bug-free code, warnings and errors show up in multiple places:
-
In the Status Bar, there is a summary of all errors and warnings counts.
-
If you open a file that has errors or warnings, they will be rendered inline with the text and in the overview ruler.
-
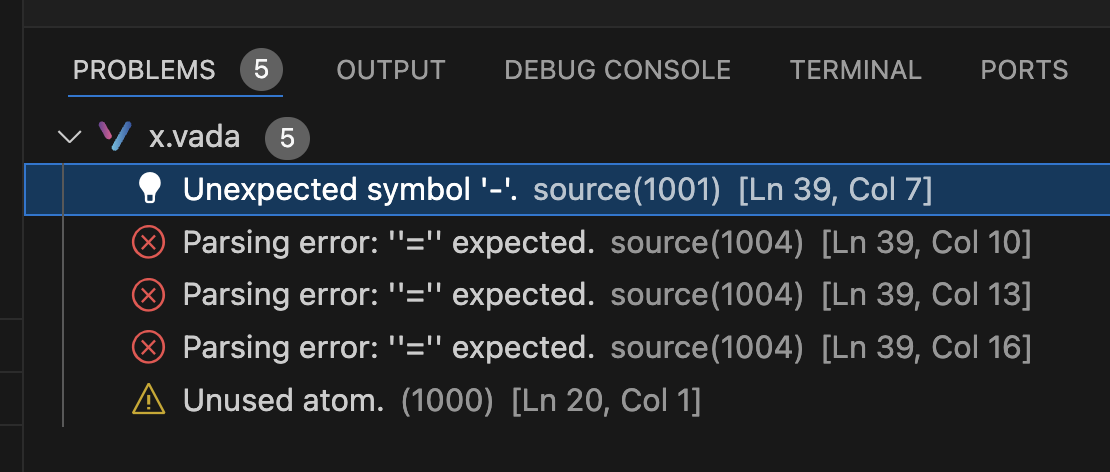
You can click on the summary or press shift+command+M to display the Problems tab with a list of all current errors.
All diagnostics are documented in the Diagnostic codes page; error reporting always include diagnostic identifiers (e.g. 1019) which are hyperlinked to manual pages with more information about the error.
|
Inline code
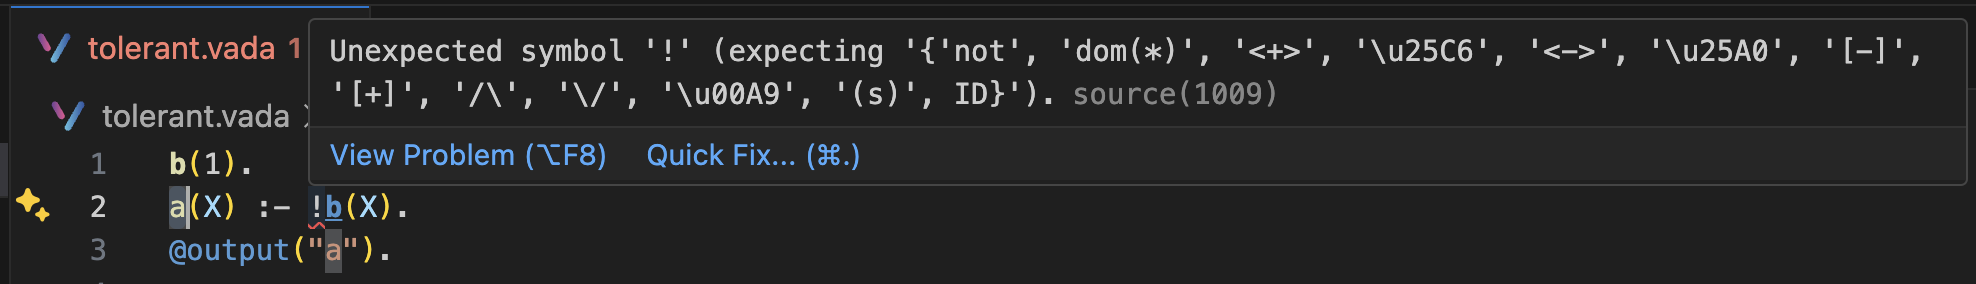
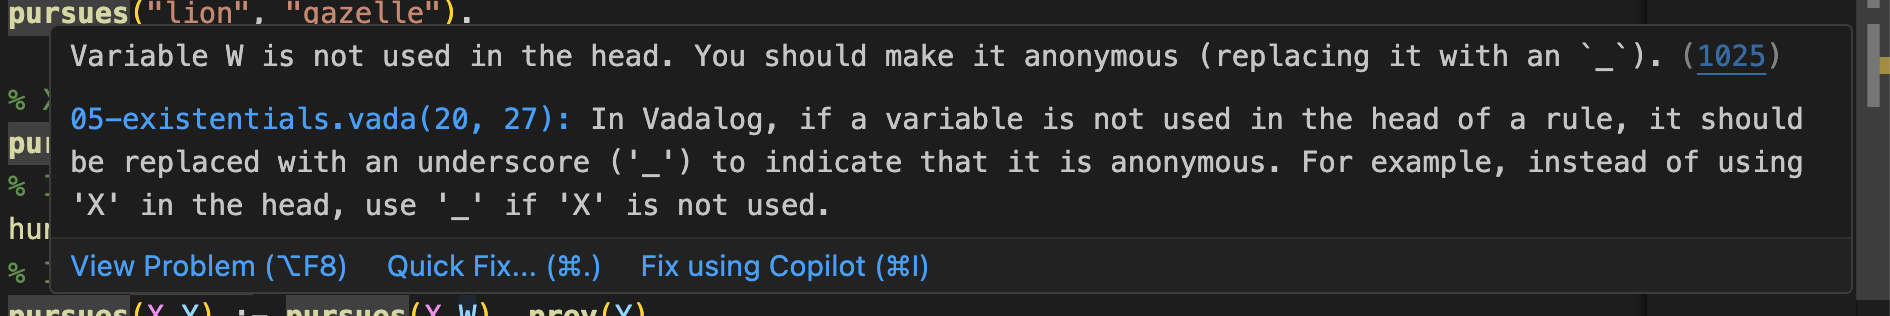
Diagnostics are shown inline with the usual squiggly line aesthetics. As Vadacode doesn’t specify custom colors, coloring follows and matches the selected theme.
Generally errors are shown in red, warnings in yellow, and hints in gray. You can always hover on the position marked by a squiggly line to get the full qualification of the diagnostic.
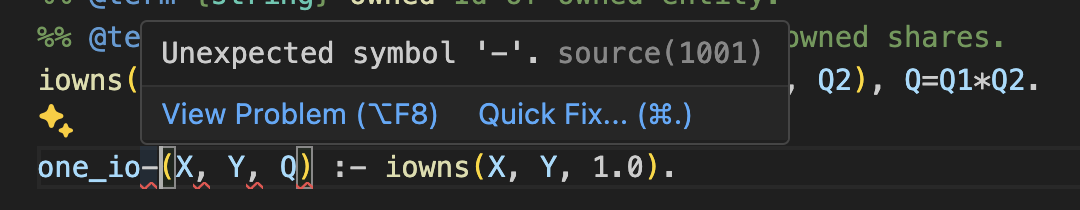
Error Tolerant Parser
Most of the time, the code in the editor is incomplete and syntactically incorrect, but developers would still expect autocomplete and other language features to work.
Therefore, an error tolerant parser is necessary: the parser generates meaningful Abstract syntax tree (AST) from partially complete code, and Vadacode provides language features based on the AST.
You can easily see the advantage of this approach if you add a parsing error in the middle of a Datalog+/- program: if the error is recoverable, Vadacode is able to resume understanding code regularly.